Custom Plastic Materials Fabrication Service
Material selection is the cornerstone of product performance, cost-effectiveness, and long-term reliability. Unlike traditional distributors, we have extensive practical experience in raw material synthesis, compound modification, and end-use applications. This deep expertise allows us to go beyond technical data sheets and deliver optimal material solutions.
What Are Injection Molding Materials?
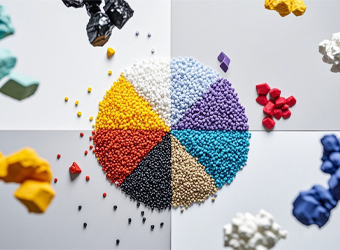
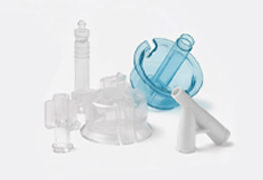
Injection molding materials are primarily polymer-based compounds that are heated to a molten state, injected into a mold cavity, and then cooled to solidify into a specific shape. Their core value lies in transforming material plasticity into product functionality.
When it comes to plastic injection molding, these are some common plastic materials used: PC/PS/PE/PP/ABS/Acrylic/POM/Resin/Nylon/Rubber
However, the list doesn’t end here. There are a variety of materials available. That’s why choosing the right plastic material for your custom injection molding project is an important decision. The appearance and performance of a plastic material can vary significantly based on the properties of its chemical composition. Depending on the part’s intended use and function, key material characteristics must be considered, such as durability, flexibility, performance, texture, density, and color. Furthermore, factors like the shrinkage rate and mold flow rate of each material must also be evaluated. Understanding these criteria helps mitigate undesirable defects like warpage, sink marks, and color streaking, which can adversely affect the part’s dimensions, tolerances, and surface finish.
According to scientific classification systems, injection molding materials are generally divided into:
- Commodity Plastics(PE,PS,PVC,PP): Large output, low price and wide application
- Engineering Plastics(PA,PC,POM,PBT):Excellent mechanical strength, heat resistance, and corrosion resistance
- Specialty Engineering Plastics(PEEK,PPS,PI):Excellent performance in extreme environments
- Thermoplastics(ABS, PC, PA):Applicable to most injection molded products
- Thermosetting Plastics(EP,PF,BMC):It sets after being heated and cured, and cannot be remelted
- Thermoplastic Elastomer(TPE, TPU):Sealing rings, shock absorbers and automotive sealing strips
- Bio-based & Biodegradable Plastics(PLA,PHA):Disposable eco-friendly packaging, biodegradable tableware
- Other Modified Plastic Materials
What Are Injection Molding Materials?
Injection molding materials are primarily polymer-based compounds that are heated to a molten state, injected into a mold cavity, and then cooled to solidify into a specific shape. Their core value lies in transforming material plasticity into product functionality.
When it comes to plastic injection molding, these are some common plastic materials used: PC/PS/PE/PP/ABS/Acrylic/POM/Resin/Nylon/Rubber
However, the list doesn’t end here. There are a variety of materials available. That’s why choosing the right plastic material for your custom injection molding project is an important decision. The appearance and performance of a plastic material can vary significantly based on the properties of its chemical composition. Depending on the part’s intended use and function, key material characteristics must be considered, such as durability, flexibility, performance, texture, density, and color. Furthermore, factors like the shrinkage rate and mold flow rate of each material must also be evaluated. Understanding these criteria helps mitigate undesirable defects like warpage, sink marks, and color streaking, which can adversely affect the part’s dimensions, tolerances, and surface finish.
According to scientific classification systems, injection molding materials are generally divided into:
- Commodity Plastics(PE,PS,PVC,PP): Large output, low price and wide application
- Engineering Plastics(PA,PC,POM,PBT):Excellent mechanical strength, heat resistance, and corrosion resistance
- Specialty Engineering Plastics(PEEK,PPS,PI):Excellent performance in extreme environments
- Thermoplastics(ABS, PC, PA):Applicable to most injection molded products
- Thermosetting Plastics(EP,PF,BMC):It sets after being heated and cured, and cannot be remelted
- Thermoplastic Elastomer(TPE, TPU):Sealing rings, shock absorbers and automotive sealing strips
- Bio-based & Biodegradable Plastics(PLA,PHA):Disposable eco-friendly packaging, biodegradable tableware
- Other Modified Plastic Materials
Our Professional Plastic Customization Service
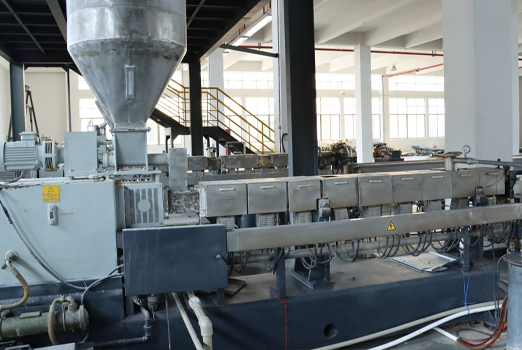
In complex product development, the successful application of materials extends far beyond selecting a datasheet—it is a rigorous, systematic engineering process. To ensure clarity, reliability, and traceability, we have structured our service into a standardized workflow. Beginning with a deep understanding of your specific needs, we proceed through four critical stages: scientific simulation, physical validation, and production support. This ensures every material recommendation is thoroughly validated, ultimately translating into solutions that enhance your product’s performance, reliability, and cost-effectiveness.
Professional Plastic Material Selection Advisory
In-Depth Requirement Analysis
Every successful partnership begins with genuine understanding. We go beyond listening to requirements, delving deep into the product’s end-use environment, mechanical loads, regulatory compliance, and cost objectives. This foundational step ensures all subsequent technical decisions are built upon a solid and reliable basis.
Material Preselection & Simulation Analysis
We foresee outcomes through data and simulation. Leveraging our extensive material database and advanced CAE tools (e.g., Mold Flow Analysis), we conduct scientific performance previews of various materials’ molding behavior before any physical trial. This approach significantly reduces development risks and costs.
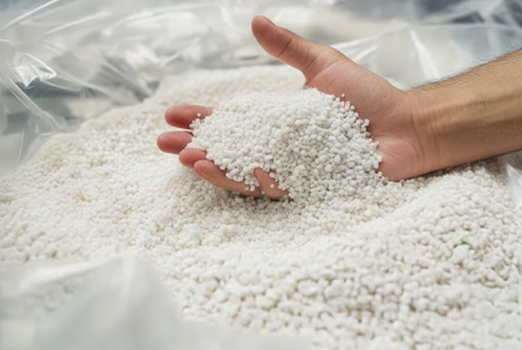
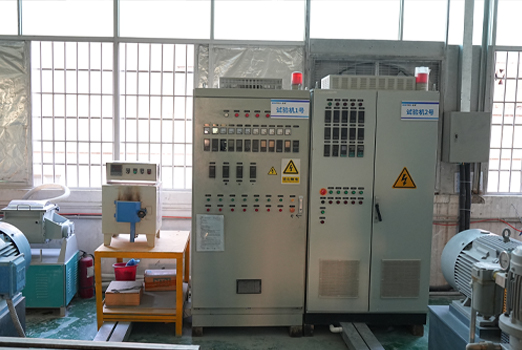
Sample Provision & Test Validation
Performance must be validated in the real world. We provide representative material plaques or trial-run parts, fully supporting your comprehensive performance testing and assembly validation. This ensures the selected material can withstand the rigors of actual application.
Mass Production Support & Continuous Optimization
Our partnership spans the entire product lifecycle. We not only provide validated mass production parameters but also engage in continuous optimization with you, based on production feedback and market evolution. This ensures sustained quality stability and cost competitiveness.
Cost-Performance Optimization Analysis
We conduct detailed trade-off studies to balance material expense with part functionality. Our goal is to identify solutions that meet or exceed your performance specifications while minimizing overall system cost, ensuring the best possible return on investment.
THE WRONG APPROACH
"Lowest material cost"
- High scrap rates
- Frequent failures
- Warranty losses
- Short product life
TOTAL COST: $8.72 per unit
VS.
OUR OPTIMIZED APPROACH
"Optimized total cost"
- 9% higher material cost
- 40% lower scrap rate
- 5-year reliability
- Lower energy use
TOTAL COST: $5.16 per unit
Plastic Material Substitution Solutions
01.Equivalent Materials Database
Material Substitution Tiers
Tier 1-Direct Substitute (Same chemical family, no re‑qualification required)
Tier 2-Functional Substitute (Different chemical family, same key properties, partial testing needed)
Tier 3-System‑Level Substitute (Requires design modifications, solves supply‑chain issues)
Other customized material solutions
Search & Matching Mechanism
Multi‑parameter filtering (temperature, strength, electrical properties, cost)
Visualized performance‑gap display (% difference)
Global Regional Material Strategies
02.Rapid Validation Process
Technical Acceleration Methods
Library of 50+ pre‑validated alternative materials
Accelerated‑aging model (48‑hour test predicts 2‑year performance)
24‑hour mold‑adjustment technique
|
DAY
|
KEY ACTIONS
|
DELIVERABLES
|
|---|---|---|
|
1
|
Urgent assessment & screening
|
3‑5 high‑potential alternative options
|
|
2-4
|
Accelerated testing protocol
|
Core‑performance test report
|
|
5-7
|
Verification & transition
|
Small‑batch trial‑production validation results
|
01.Equivalent Materials Database
Material Substitution Tiers
Tier 1-Direct Substitute (Same chemical family, no re‑qualification required)
Tier 2-Functional Substitute (Different chemical family, same key properties, partial testing needed)
Tier 3-System‑Level Substitute (Requires design modifications, solves supply‑chain issues)
Other customized material solutions
Search & Matching Mechanism
Multi‑parameter filtering (temperature, strength, electrical properties, cost)
Visualized performance‑gap display (% difference)
Global Regional Material Strategies
02.Rapid Validation Process
Technical Acceleration Methods
Library of 50+ pre‑validated alternative materials
Accelerated‑aging model (48‑hour test predicts 2‑year performance)
24‑hour mold‑adjustment technique

Plastic Materials Testing & Verification
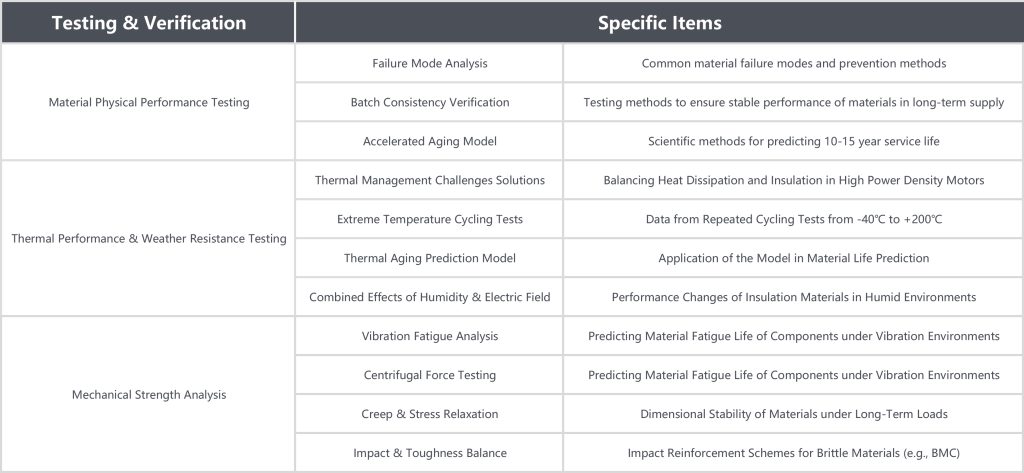
When your product promises a decade-long service life or must meet stringent safety certifications, you need more than just a material supplier’s assurance—you require independent, authoritative performance validation. Our testing laboratories and certification experts serve as the solid backbone for your product’s reliability, safety, and global compliance. We are dedicated to providing precise test data that delivers decisive evidence for your material selection, clears regulatory hurdles, and safeguards your product’s successful market launch.
|
Testing & Verification
|
Specific Items
|
|
|---|---|---|
|
Material Physical Performance Testing
|
Failure Mode Analysis
|
Common material failure modes and prevention methods
|
|
Batch Consistency Verification
|
Testing methods to ensure stable performance of materials in long-term supply
|
|
|
Accelerated Aging Model
|
Scientific methods for predicting 10-15 year service life
|
|
|
Thermal Performance & Weather Resistance Testing
|
Thermal Management Challenges Solutions
|
Balancing Heat Dissipation and Insulation in High Power Density Motors
|
|
Extreme Temperature Cycling Tests
|
Data from Repeated Cycling Tests from -40°C to +200°C
|
|
|
Thermal Aging Prediction Model
|
Application of the Model in Material Life Prediction
|
|
|
Combined Effects of Humidity & Electric Field
|
Performance Changes of Insulation Materials in Humid Environments
|
|
|
Mechanical Strength Analysis
|
Vibration Fatigue Analysis
|
Predicting Material Fatigue Life of Components under Vibration Environments
|
|
Centrifugal Force Testing
|
Predicting Material Fatigue Life of Components under Vibration Environments
|
|
|
Creep & Stress Relaxation
|
Dimensional Stability of Materials under Long-Term Loads
|
|
|
Impact & Toughness Balance
|
Impact Reinforcement Schemes for Brittle Materials (e.g., BMC)
|
|
Choose the Best Technical Consultant for Your Project
True expertise in materials stems not only from knowledge but, more critically, from hands-on practice. Rooted in the frontline of injection molding and mold manufacturing, our professional perspective is fundamentally different. We do not merely provide material specifications; we translate decades of production experience into reliable solutions that foresee risks, optimize performance, and ultimately reduce your total cost of ownership. These four core advantages represent our commitment to delivering expert value.
Materials Insight from Production Experience
We delve into the essence of materials. Leveraging raw material production experience, we understand how molecular chain structure, crystallization behavior, and the interaction of additives and fillers fundamentally determine a material’s performance limits. This means we can predict a material’s strength degradation after long-term thermal aging or its insulation stability in high-frequency electric fields, rather than just providing data at room temperature.
- Relationship Between Molecular Structure And Performance
- Process-Structure-Performance Triangle
- Aging Mechanism Prediction
Manufacturing-Focused Co-Design
We delve into the essence of materials. Leveraging raw material production experience, we understand how molecular chain structure, crystallization behavior, and the interaction of additives and fillers fundamentally determine a material’s performance limits. This means we can predict a material’s strength degradation after long-term thermal aging or its insulation stability in high-frequency electric fields, rather than just providing data at room temperature.
- Precise Matching Of Rheology And Mold Design
- Specialized Processing Considerations for Modified & Engineering Materials
- Integrated Optimization Of Materials, Processes, And Equipment.
Full Traceability & Quality Assurance
We have established a comprehensive end-to-end data tracking system that meticulously records every critical step in the production process. This system collects and correlates key information, including the origin of raw materials, quality inspection reports, specific parameters such as temperature, pressure, and duration during production, and the final product’s appearance, dimensions, and performance test results. Each component has its own complete “electronic file,” ensuring that every step is verifiable and traceable.
This comprehensive transparency not only makes product quality more stable and reliable but also builds solid trust. Even in the rare event of after-sales issues or quality concerns, the system can accurately pinpoint the root cause within minutes, quickly identifying any deviations in the production process. This allows us to rapidly implement targeted improvement and preventative measures.
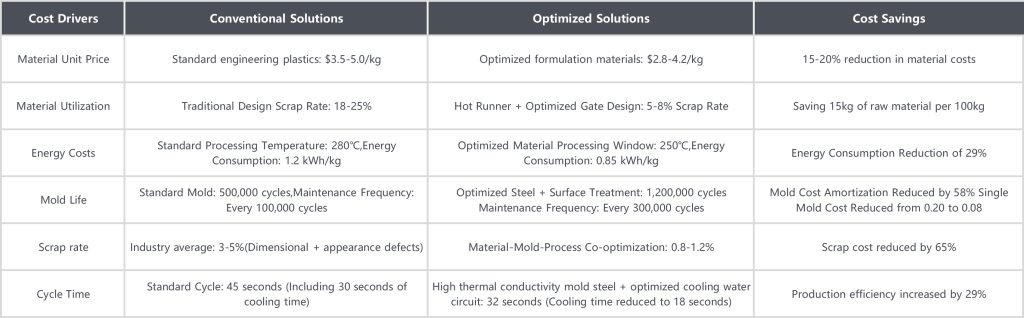
Total Cost Optimization
We are committed to optimizing your “Total Cost of Ownership,” not just the material price per unit. We use our experience to help you precisely balance upfront material costs against long-term reliability, maintenance costs, and brand reputation risks. Choosing a more durable material may involve a slightly higher initial investment, but it prevents massive costs associated with field failures, recalls, repairs, and reputational damage.
- Risk Quantification Analysis
- Precision Matching of Design Lifespan
- Sustainability & Economic Optimization.
|
Cost Drivers
|
Conventional Solutions
|
Optimized Solutions
|
Cost Savings
|
|---|---|---|---|
|
Material Unit Price
|
Standard engineering plastics: $3.5-5.0/kg
|
Optimized formulation materials: $2.8-4.2/kg
|
15-20% reduction in material costs
|
|
Material Utilization
|
Traditional Design Scrap Rate: 18-25%
|
Hot Runner + Optimized Gate Design: 5-8% Scrap Rate
|
Saving 15kg of raw material per 100kg
|
|
Energy Costs
|
Standard Processing Temperature: 280°C,Energy Consumption: 1.2 kWh/kg
|
Optimized Material Processing Window: 250°C,Energy Consumption: 0.85 kWh/kg
|
Energy Consumption Reduction of 29%
|
|
Mold Life
|
Standard Mold: 500,000 cycles,Maintenance Frequency: Every 100,000 cycles
|
Optimized Steel + Surface Treatment: 1,200,000 cycles Maintenance Frequency: Every 300,000 cycles
|
Mold Cost Amortization Reduced by 58% Single Mold Cost Reduced from 0.20 to 0.08
|
|
Scrap rate
|
Industry average: 3-5%(Dimensional + appearance defects)
|
Material-Mold-Process Co-optimization: 0.8-1.2%
|
Scrap cost reduced by 65%
|
|
Cycle Time
|
Standard Cycle: 45 seconds (Including 30 seconds of cooling time)
|
High thermal conductivity mold steel + optimized cooling water circuit: 32 seconds (Cooling time reduced to 18 seconds)
|
Production efficiency increased by 29%
|
How To Choose The Right Injection Molding Material For your parts?
The quest for the “perfect match” material for your part is a complex, multi-dimensional challenge. It goes far beyond consulting material datasheets and requires a deep understanding of the product’s real-world environment, mechanical stress, chemical exposure, and the economics of scale production. Let us be your guide in navigating the core factors and scientific methodology that influence material selection.
Download Injection Molding Material Application Guide
Plastic Material Requirements for Different Industries
Automotive Industry
Core Requirements: High temperature resistance (150°C+), oil resistance, flame retardancy (UL94 V-0), dimensional stability over a wide temperature range
Key Standards: USCAR-2, ISO 16750, GMW3172, VW 80101
Recommended Materials: PPS, PEEK, Specially formulated PA66
Medical Devices
Core Requirements: ISO 10993 biocompatibility, sterilizability (high-pressure steam/gamma rays), no additive leaching
Key Standards: USP Class VI, FDA CFR 21, ISO 13485
Recommended Materials: Medical-grade POM, PEEK, Transparent PC
Consumer Electronics
Core Requirements: Thin-walled flowability (≤0.6mm), surface quality, electromagnetic shielding, flame retardancy
Key Standards: UL 94 V-0/V-2, IEC 60601, RoHS
Recommended Materials: LCP, High-Flow PC/ABS, Flame-Retardant PBT
Industrial Equipment
Core Requirements: 20+ Year Service Life, Abrasion Resistance, Chemical Resistance, Mechanical Strength Retention
Key Standards: IEC 60216, NEMA LI-1, ASTM D638/D790
Recommended Materials: Reinforced PPS, PEEK, Special BMC
Recommended Plastic Materials for Harsh Environments
Extreme Temperature Environments
Challenges: Temperature cycling from -50°C to +180°C, thermal shock, low-temperature brittleness
Solutions: Low-temperature modified PPS (non-cracking at -60°C), high-temperature PEEK (continuous use at +250°C), special BMC formulations
Validation Standards: ASTM D648 HDT, IEC 60068-2-14 temperature cycling test
High Humidity & Chemical Exposure
Challenges: Hydrolysis due to high temperature and humidity, chemical solvent corrosion, and decreased insulation performance
Solutions: Hydrolysis-resistant PBT, PPS, cross-linked BMC, hydrophobic surface treatment
Validation Standards: 85°C 1000-hour test, IEC 60093 surface resistivity test
High Electrical Stress Environment
Challenges: Challenges: High voltage (>600V), high-frequency switching, corona discharge, partial discharge
Solutions: High CTI value BMC (600V+), corona-resistant PI film, special filler reinforcement
Validation Standards: IEC 60587 Tracking test, ASTM D2303 Arc resistance
Mechanical Stress & Vibration
Challenges: Mechanical Stress and Vibration
Solutions: High-rigidity PPS+40%GF, PEEK+CF, reinforced BMC
Validation Standards: ISO 16770 Vibration fatigue test, ASTM D2990 Creep test
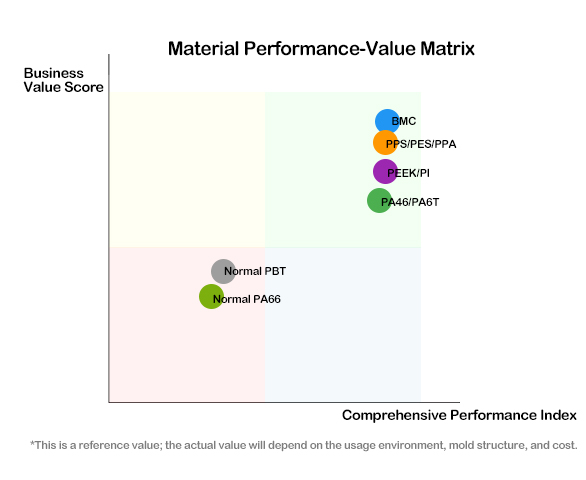
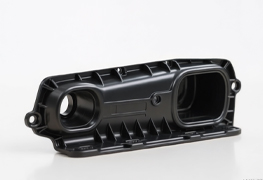
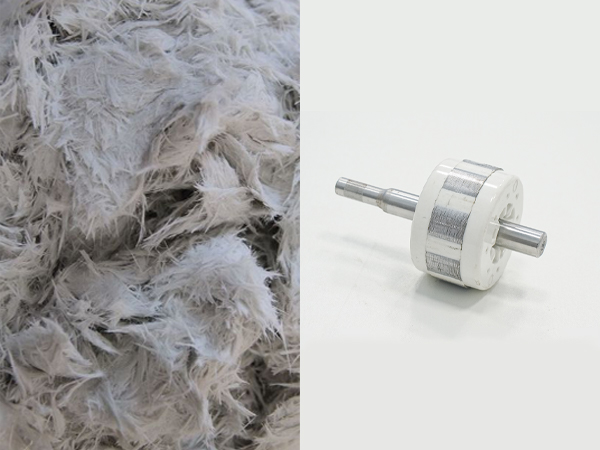
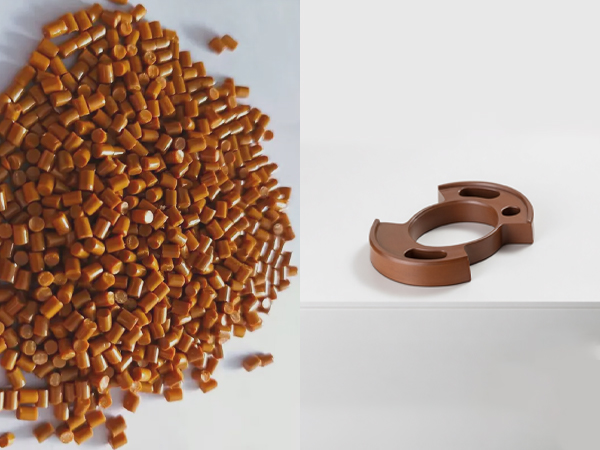
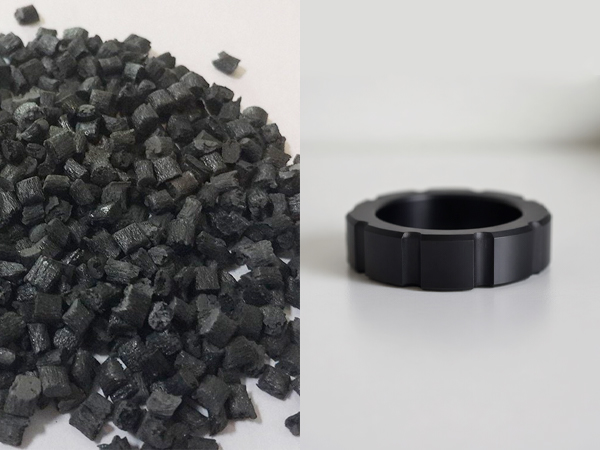
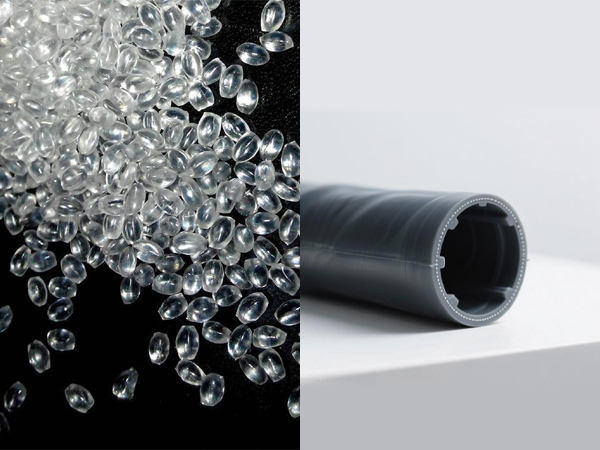
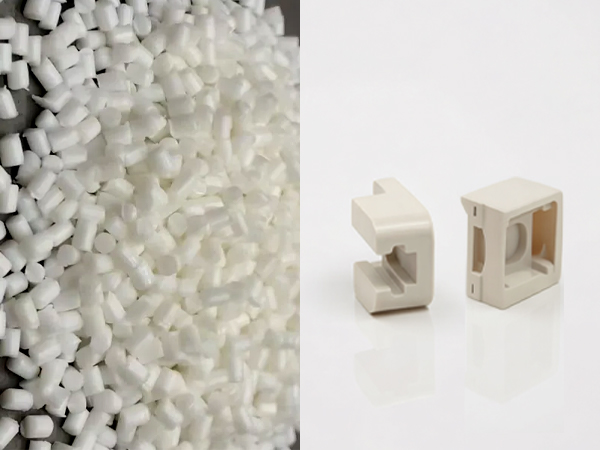
Some Injection Molding Materials Cases
Material selection is more than just choosing a set of specifications; it determines the final performance limits, reliability, and cost of a part. Theoretical data sheets cannot fully reveal the performance of materials under actual forming and load conditions. Here are some examples of how high-performance raw materials are transformed into high-quality parts that meet stringent requirements.
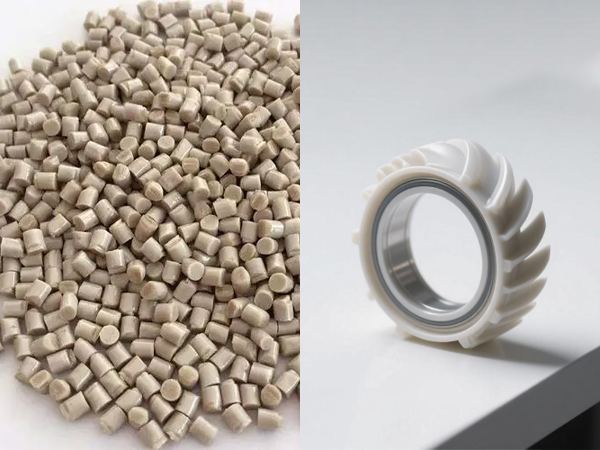
PEEK
BMC
PI
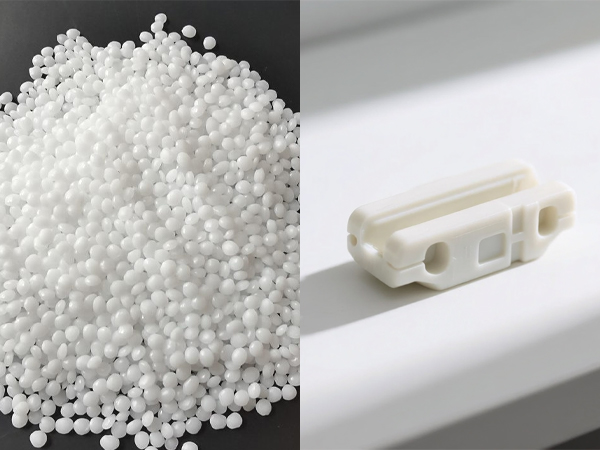
POM
PPS
TPU
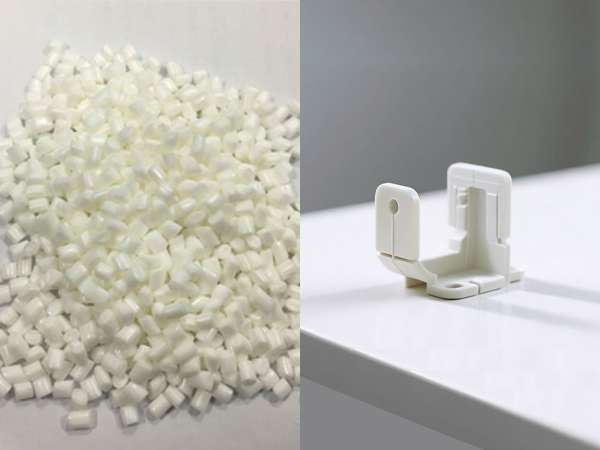
PBT
PA6
Client Inquiries

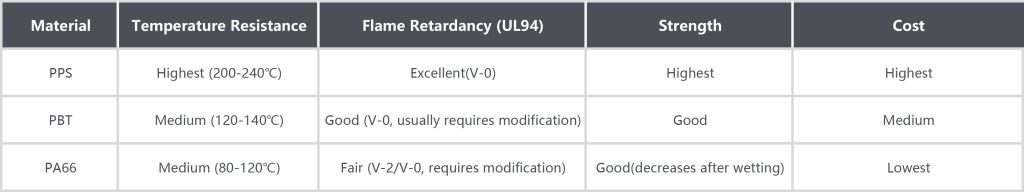
“For a part requiring high heat and flame resistance, how do I choose between PPS, PBT, and PA66? Where is the cost-performance balance?”
The choice depends on your specific temperature rating, structural load, and cost budget. It’s a classic performance-cost balance decision.
|
Material
|
Temperature Resistance
|
Flame Retardancy (UL94)
|
Strength
|
Cost
|
|---|---|---|---|---|
|
PPS
|
Highest (200-240°C)
|
Excellent(V-0)
|
Highest
|
Highest
|
|
PBT
|
Medium (120-140°C)
|
Good (V-0, usually requires modification)
|
Good
|
Medium
|
|
PA66
|
Medium (80-120°C)
|
Fair (V-2/V-0, requires modification)
|
Good(decreases after wetting)
|
Lowest
|
Decision Recommendations:
- Step 1: Determine the maximum operating temperature. If consistently >150°C, PPS is the only reliable choice.
- Step 2: Within the <150°C range, if high dimensional stability and low moisture absorption are required, choose PBT; if higher toughness, fatigue resistance, and controllable ambient humidity are required, PA66 can be selected.
- Step 3: Consider the total cost of ownership. PA66 has a lower unit price, but may require more complex designs to compensate for its moisture absorption; PBT offers a better balance between stability and cost.
“To reduce weight while maintaining strength, are Long Glass Fiber materials truly superior to short fiber? What is the quantifiable performance gain?”
Yes, in the right applications, long glass fiber reinforced plastics (LFT) offer a significant advantage in impact resistance, creep resistance, and structural integrity. However, it’s not necessary in all situations.
Key Differences and Quantitative Improvements:
- Mechanical Properties: Long glass fibers (typically > 10 mm in length) form a three-dimensional network reinforcement structure in plastics, while short glass fibers (typically < 1 mm) provide point reinforcement.
- Impact Strength: Can be increased by 50%-200%, especially at low temperatures.
- Creep Resistance: Under long-term load, the deformation is several times lower than that of short glass fiber materials.
- Anisotropy: Short glass fiber products exhibit significant differences in shrinkage and strength in different directions; long glass fiber products show better isotropy, more uniform deformation, and greater dimensional stability.
- Disadvantages and Considerations: LFT has slightly lower flowability, requires more sophisticated mold design (especially for gates and runners) and injection molding processes, and its material cost is approximately 20%-40% higher.
Usage Recommendations:
- Choose LFT when your parts are subjected to: high dynamic impacts (e.g., automotive front-end modules, sports equipment), long-term continuous loads (e.g., shelving, logistics pallets), or require stable performance over a wide temperature range.
- Short glass fibers are sufficient for applications that primarily provide rigidity and basic strength, have complex shapes, or are extremely cost-sensitive.
"My part is currently CNC machined in small volumes. At what production quantity does switching to injection molding become cost-effective? How is the break-even point calculated?"
The break-even point typically occurs between 500 and 5,000 units per year, depending on the complexity and size of the parts.
Calculation Method and Example:
Calculate the total cost of CNC machining: (CNC machining cost per unit + Material cost) × Total demand
Calculate the total cost of injection molding: Mold cost + (Material cost per unit × Total demand)
Equalize these two to calculate the production volume.
Simplified Formula:
Break-even production volume = Total mold investment / (CNC unit cost – Injection unit cost)
Case Assumption:A medium-sized plastic shell.
CNC unit cost: ¥150
Injection unit cost: ¥15
Mold investment: ¥80,000
Calculation:
80,000 / (150 – 15) ≈ 593 units
Conclusion: When demand exceeds approximately 600 units, the total cost of injection molding will be lower.
Furthermore, beyond this point, you will also gain the speed, consistency, and surface quality advantages of injection molding. We can perform a precise analysis based on your specific part drawings.
“To reduce costs, I'm considering replacing imported POM or PBT with domestically produced materials. What are the risks? What verifications need to be redone?”
The primary risk lies in batch consistency and long-term reliability, rather than initial performance. However, through system validation, the risk is manageable.
Required Validation Steps (Risk Control Process):
1.Basic Property Benchmarking:Compare density, melt index, tensile/flexural strength, etc., to ensure datasheet consistency.
2.Key Application Performance Testing:
Electrical Components: Test CTI (tracking index) and flame retardancy.
Structural Components: Test impact strength (especially at low temperatures) and fatigue resistance.
Weathering Components: Conduct thermal aging tests.
3.Process Window Validation:Test on your production equipment to confirm compatibility of processing temperature, flowability, and crystallization rate with existing processes.
4.Small Batch Pilot Production and Assembly Testing:Produce 500-1,000 units for full-size inspection and assembly validation.
5.Long-Term Reliability Assessment:** Conduct accelerated aging tests (e.g., high temperature and humidity tests) based on application requirements.
Our professional support: We have a pre-validated database of domestically produced materials and accelerated testing protocols, which can shorten the above validation cycle from months to weeks, and provide you with detailed comparative test reports, so that your alternative decisions are based on data rather than guesswork.
“I have a part with complex internal structures. Can it be achieved with conventional molding, or does it require special mold techniques or materials like LCP?”
This depends entirely on the structural details. Many “complex” structures can be achieved through clever mold design, but some require special processes or materials.
Solution Layers:
Level 1: Optimizing Mold Design
Slider/Ejector: Solves external undercuts.
Internal Thread Inserts: Solves internal thread demolding.
Air-Assisted/Water-Assisted Molding: Creates thick-walled hollow channels, saving material and avoiding shrinkage marks.
Level 2: Using High-Performance Materials
Ultra-High Flow Materials: Such as LCP, can fill extremely thin (0.15mm) wall thicknesses and microstructures.
Two-Color Injection Molding of Soft and Hard Rubbers: Achieves one-piece seals and non-slip grips.
Level 3: Special Processes
Melting Injection: Used to create one-piece, draft-free complex internal channels (such as automotive engine intake manifolds).
Metal Powder Injection Molding (MIM): Used for miniature, high-precision complex metal structures.
Our Recommendation: Please provide us with your 3D drawings for a free “Manufacturability Analysis”. Our engineers will provide an evaluation report within 48 hours, clearly outlining:
1) How to achieve this through mold design;
2) Recommended materials and processes;
3) Estimated costs and risks.
This ensures your design achieves the optimal balance between creativity and manufacturability.
“How do we balance material cost with product lifetime? Premium materials are too expensive, while standard materials don't meet our performance requirements.”
We focus on Total Cost of Ownership (TCO) rather than upfront material cost. Our comprehensive TCO analysis includes: material cost per part, processing efficiency, field failure rates, warranty costs, end-of-life considerations, and supply chain risk factors. We employ a value engineering methodology that identifies which performance characteristics are truly critical for your specific application versus those where cost optimization is possible without compromising reliability.
For example, in a recent automotive cooling fan project, switching from standard PBT to our modified PPS increased material cost by 18%, but reduced processing cycle time by 22% and extended service life by 3.5x. This resulted in 31% lower total cost over the product’s lifecycle. In another industrial motor application, our material science team developed a proprietary glass/mineral hybrid filled nylon that delivered 90% of premium PPS performance at just 65% of the cost, with validated performance at 150°C continuous operation.
We’ve developed a decision matrix tool that identifies the optimal material based on your specific performance thresholds, production volume, warranty requirements, and market positioning. Our predictive modeling capabilities simulate material degradation under actual operating conditions, allowing us to pinpoint exactly where performance margins can be safely reduced to lower costs. Typically, clients discover that the “sweet spot” isn’t the cheapest or most expensive material, but one that precisely matches their critical performance requirements while allowing strategic cost reduction in non-critical areas. This approach has helped our clients achieve an average of 24% reduction in total product costs while simultaneously improving field reliability metrics by 40%.
“How to ensure the material maintains performance stability under long-term high-temperature conditions?”
Ensuring the performance stability of materials under long-term high-temperature environments requires a comprehensive approach, starting with proper material selection and continuing through a rigorous validation process. First, prioritize materials with high relative temperature index (RTI) values certified by UL 746B, as the RTI value indicates the temperature at which a material retains 50% of its critical performance after 60,000–100,000 hours of exposure. For applications operating continuously above 150°C, consider using polymers with high inherent stability, such as PPS, PEEK, PI, or well-formulated BMC compounds using thermally stable fillers and coupling agents.
Accelerated aging testing using the Arrhenius model principle involves thermal aging tests at multiple high temperatures (typically 20–30°C higher than the expected operating temperature), with regular monitoring of critical properties such as tensile strength, impact strength, and electrical insulation resistance. This data can be used to extrapolate performance over many years of real-world use.
Crucially, material evaluation should not be conducted in isolation but rather under simulated operating conditions and within the geometry of actual components, including thermal cycling between minimum and maximum operating temperatures. This can reveal potential failure modes, such as differential thermal expansion stress at material interfaces or filler-matrix separation, which static testing may miss.
For critical applications, in-service monitoring procedures should be established to periodically test field samples and compare them to baseline performance. Collaborate with material suppliers who can provide long-term stability data from real-world applications, rather than relying solely on datasheet values. Finally, appropriate design factors should be incorporated to address the inevitable (though minimized) performance degradation over time. This systematic approach, combining materials science expertise with application-specific validation, ensures reliable product performance throughout its entire lifecycle, even under the most demanding high-temperature conditions.
FAQ
“For a part requiring high heat and flame resistance, how do I choose between PPS, PBT, and PA66? Where is the cost-performance balance?”
The choice depends on your specific temperature rating, structural load, and cost budget. It’s a classic performance-cost balance decision.
Decision Recommendations:
- Step 1: Determine the maximum operating temperature. If consistently >150°C, PPS is the only reliable choice.
- Step 2: Within the <150°C range, if high dimensional stability and low moisture absorption are required, choose PBT; if higher toughness, fatigue resistance, and controllable ambient humidity are required, PA66 can be selected.
- Step 3: Consider the total cost of ownership. PA66 has a lower unit price, but may require more complex designs to compensate for its moisture absorption; PBT offers a better balance between stability and cost.
“To reduce weight while maintaining strength, are Long Glass Fiber materials truly superior to short fiber? What is the quantifiable performance gain?”
Yes, in the right applications, long glass fiber reinforced plastics (LFT) offer a significant advantage in impact resistance, creep resistance, and structural integrity. However, it’s not necessary in all situations.
Key Differences and Quantitative Improvements:
- Mechanical Properties: Long glass fibers (typically > 10 mm in length) form a three-dimensional network reinforcement structure in plastics, while short glass fibers (typically < 1 mm) provide point reinforcement.
- Impact Strength: Can be increased by 50%-200%, especially at low temperatures.
- Creep Resistance: Under long-term load, the deformation is several times lower than that of short glass fiber materials.
- Anisotropy: Short glass fiber products exhibit significant differences in shrinkage and strength in different directions; long glass fiber products show better isotropy, more uniform deformation, and greater dimensional stability.
- Disadvantages and Considerations: LFT has slightly lower flowability, requires more sophisticated mold design (especially for gates and runners) and injection molding processes, and its material cost is approximately 20%-40% higher.
Usage Recommendations:
- Choose LFT when your parts are subjected to: high dynamic impacts (e.g., automotive front-end modules, sports equipment), long-term continuous loads (e.g., shelving, logistics pallets), or require stable performance over a wide temperature range.
- Short glass fibers are sufficient for applications that primarily provide rigidity and basic strength, have complex shapes, or are extremely cost-sensitive.
"My part is currently CNC machined in small volumes. At what production quantity does switching to injection molding become cost-effective? How is the break-even point calculated?"
The break-even point typically occurs between 500 and 5,000 units per year, depending on the complexity and size of the parts.
Calculation Method and Example:
Calculate the total cost of CNC machining: (CNC machining cost per unit + Material cost) × Total demand
Calculate the total cost of injection molding: Mold cost + (Material cost per unit × Total demand)
Equalize these two to calculate the production volume.
Simplified Formula:
Break-even production volume = Total mold investment / (CNC unit cost – Injection unit cost)
Case Assumption:A medium-sized plastic shell.
CNC unit cost: ¥150
Injection unit cost: ¥15
Mold investment: ¥80,000
Calculation:
80,000 / (150 – 15) ≈ 593 units
Conclusion: When demand exceeds approximately 600 units, the total cost of injection molding will be lower.
Furthermore, beyond this point, you will also gain the speed, consistency, and surface quality advantages of injection molding. We can perform a precise analysis based on your specific part drawings.
“To reduce costs, I'm considering replacing imported POM or PBT with domestically produced materials. What are the risks? What verifications need to be redone?”
The primary risk lies in batch consistency and long-term reliability, rather than initial performance. However, through system validation, the risk is manageable.
Required Validation Steps (Risk Control Process):
1.Basic Property Benchmarking:Compare density, melt index, tensile/flexural strength, etc., to ensure datasheet consistency.
2.Key Application Performance Testing:
Electrical Components: Test CTI (tracking index) and flame retardancy.
Structural Components: Test impact strength (especially at low temperatures) and fatigue resistance.
Weathering Components: Conduct thermal aging tests.
3.Process Window Validation:Test on your production equipment to confirm compatibility of processing temperature, flowability, and crystallization rate with existing processes.
4.Small Batch Pilot Production and Assembly Testing:Produce 500-1,000 units for full-size inspection and assembly validation.
5.Long-Term Reliability Assessment:** Conduct accelerated aging tests (e.g., high temperature and humidity tests) based on application requirements.
Our professional support: We have a pre-validated database of domestically produced materials and accelerated testing protocols, which can shorten the above validation cycle from months to weeks, and provide you with detailed comparative test reports, so that your alternative decisions are based on data rather than guesswork.
“I have a part with complex internal structures. Can it be achieved with conventional molding, or does it require special mold techniques or materials like LCP?”
This depends entirely on the structural details. Many “complex” structures can be achieved through clever mold design, but some require special processes or materials.
Solution Layers:
Level 1: Optimizing Mold Design
Slider/Ejector: Solves external undercuts.
Internal Thread Inserts: Solves internal thread demolding.
Air-Assisted/Water-Assisted Molding: Creates thick-walled hollow channels, saving material and avoiding shrinkage marks.
Level 2: Using High-Performance Materials
Ultra-High Flow Materials: Such as LCP, can fill extremely thin (0.15mm) wall thicknesses and microstructures.
Two-Color Injection Molding of Soft and Hard Rubbers: Achieves one-piece seals and non-slip grips.
Level 3: Special Processes
Melting Injection: Used to create one-piece, draft-free complex internal channels (such as automotive engine intake manifolds).
Metal Powder Injection Molding (MIM): Used for miniature, high-precision complex metal structures.
Our Recommendation: Please provide us with your 3D drawings for a free “Manufacturability Analysis”. Our engineers will provide an evaluation report within 48 hours, clearly outlining:
1) How to achieve this through mold design;
2) Recommended materials and processes;
3) Estimated costs and risks.
This ensures your design achieves the optimal balance between creativity and manufacturability.
“How do we balance material cost with product lifetime? Premium materials are too expensive, while standard materials don't meet our performance requirements.”
We focus on Total Cost of Ownership (TCO) rather than upfront material cost. Our comprehensive TCO analysis includes: material cost per part, processing efficiency, field failure rates, warranty costs, end-of-life considerations, and supply chain risk factors. We employ a value engineering methodology that identifies which performance characteristics are truly critical for your specific application versus those where cost optimization is possible without compromising reliability.
For example, in a recent automotive cooling fan project, switching from standard PBT to our modified PPS increased material cost by 18%, but reduced processing cycle time by 22% and extended service life by 3.5x. This resulted in 31% lower total cost over the product’s lifecycle. In another industrial motor application, our material science team developed a proprietary glass/mineral hybrid filled nylon that delivered 90% of premium PPS performance at just 65% of the cost, with validated performance at 150°C continuous operation.
We’ve developed a decision matrix tool that identifies the optimal material based on your specific performance thresholds, production volume, warranty requirements, and market positioning. Our predictive modeling capabilities simulate material degradation under actual operating conditions, allowing us to pinpoint exactly where performance margins can be safely reduced to lower costs. Typically, clients discover that the “sweet spot” isn’t the cheapest or most expensive material, but one that precisely matches their critical performance requirements while allowing strategic cost reduction in non-critical areas. This approach has helped our clients achieve an average of 24% reduction in total product costs while simultaneously improving field reliability metrics by 40%.
“How to ensure the material maintains performance stability under long-term high-temperature conditions?”
Ensuring the performance stability of materials under long-term high-temperature environments requires a comprehensive approach, starting with proper material selection and continuing through a rigorous validation process. First, prioritize materials with high relative temperature index (RTI) values certified by UL 746B, as the RTI value indicates the temperature at which a material retains 50% of its critical performance after 60,000–100,000 hours of exposure. For applications operating continuously above 150°C, consider using polymers with high inherent stability, such as PPS, PEEK, PI, or well-formulated BMC compounds using thermally stable fillers and coupling agents.
Accelerated aging testing using the Arrhenius model principle involves thermal aging tests at multiple high temperatures (typically 20–30°C higher than the expected operating temperature), with regular monitoring of critical properties such as tensile strength, impact strength, and electrical insulation resistance. This data can be used to extrapolate performance over many years of real-world use.
Crucially, material evaluation should not be conducted in isolation but rather under simulated operating conditions and within the geometry of actual components, including thermal cycling between minimum and maximum operating temperatures. This can reveal potential failure modes, such as differential thermal expansion stress at material interfaces or filler-matrix separation, which static testing may miss.
For critical applications, in-service monitoring procedures should be established to periodically test field samples and compare them to baseline performance. Collaborate with material suppliers who can provide long-term stability data from real-world applications, rather than relying solely on datasheet values. Finally, appropriate design factors should be incorporated to address the inevitable (though minimized) performance degradation over time. This systematic approach, combining materials science expertise with application-specific validation, ensures reliable product performance throughout its entire lifecycle, even under the most demanding high-temperature conditions.
Material Intelligence for Manufacturing Excellence
- Download Our Complete Materials Database
- Schedule a Custom Test for Your Application
- Request a Material Consultation
- No.2, South Huatai East Road, Caosan PioneerPark,ZhongShan,Guangdong,China
- +86 13326981626
- ocean.h@wanglai.cn
CAPABILITIES


Copyright ©2025 Wontech | Powered by Wontech.All Rights Reserved.